Observing Dapr applications with New Relic One
It was back in 2019 at Microsoft Ignite in Orlando when I discovered a new project referred to as Distributed Application Runtime, or Dapr for short. This immediately caught my attention and Mark Russinovich did an amazing job presenting this to the audience.
Dapr is quite an interesting project for me in many ways. First of all, software architecture is near and dear to my heart and Dapr solves a lot of the challenges developers typically face when designing and implementing applications. Its portable, event-driven runtime makes it easy for developers to build resilient, stateless and stateful microservices applications that run on the cloud or edge and embraces the diversity of languages and developer frameworks.
Another area that I am passionate about is observability. Given the complexity of today’s flexible and highly scalable applications, it can be challenging to exactly understand the state and health of applications. In my conversations with both enterprise and commercial size customers I hear that it is fundamental to have proper monitoring in place to observe the behavior of application components. This is especially true in hyperscale environments or when leveraging orchestration systems such as Kubernetes. In this blog post I want to highlight the basic steps on how to get started with observing Daperized applications. I’ll also touch on the benefits that will be achieved and some patterns I see that can be useful.
How can Dapr applications be observed?
Observability is a key aspect when you not only want to understand the When? and the What?, but also the Why? and the How? Understanding not just when an issue occurs but what caused it and why is critical for root causing an issue.
Dapr was built with monitoring and observability in mind. One of the value propositions of Dapr is the fact that you don’t have to instrument your applications in order to capture traces and metrics. This removes the hassle of gathering insights from within your applications.
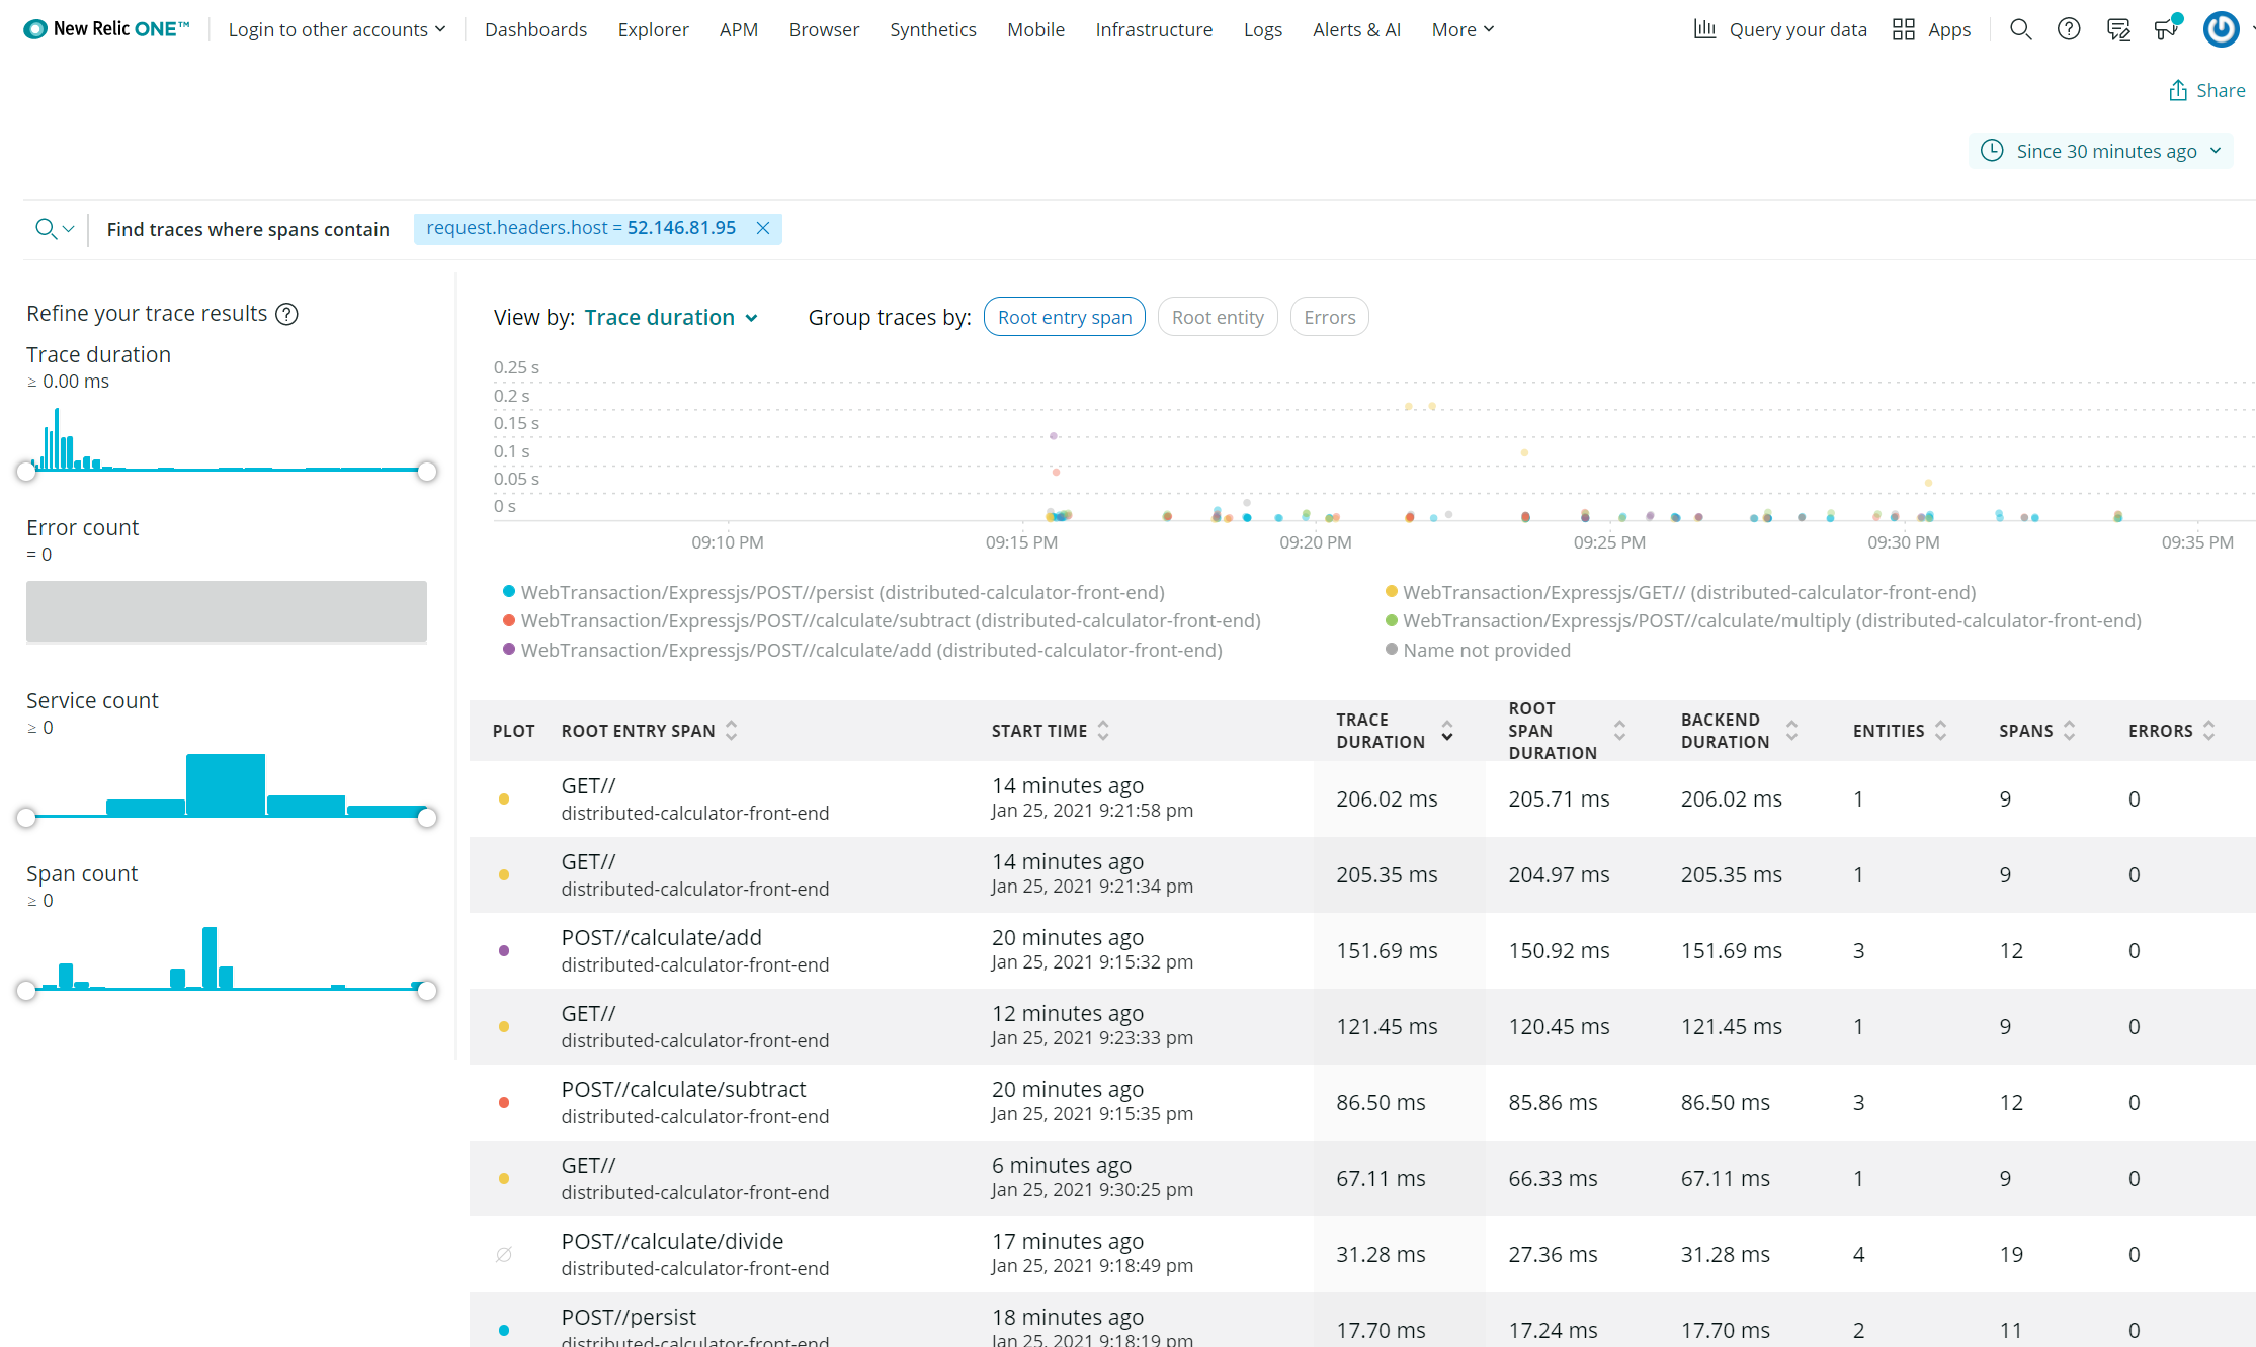
You can use several monitoring tools in the backend, but in this blog I’ll focus on New Relic - The easiest way to get started is by configuring Dapr to send the traces to New Relic’s trace API using the Zipkin trace format.
Language agents
Alternatively, you could leverage a New Relic language agent. This type of integration also does not require any changes to the application source. In addition to the metrics and traces, you will also be able to gather a whole breadth of events from the application logic. This is important if you want to get down to the nitty-gritty details of the actual usage of the application.
The Rise of OpenTelemetry
Standardization is becoming more and more important in the software industry. The incredible focus and demand for open source software is just one of the aspects.
Vendor-neutral open standards matter. And OpenTelemetry, a Cloud Native Computing Foundation (CNCF) project, has created an open specification you can use to standardize how you collect and send telemetry data to backend platforms.
A couple of months ago, New Relic decided to make all its language agents open source. You can still benefit from these agents and they provide tremendous insights into your applications.
In addition to these language agents, New Relic also started to build on the OpenTelemetry standard. Beta implementations of OpenTelemetry support including exporters to pipe telemetry to a backend, like New Relic, are already released.
Currently, New Relic provides exporters for OpenTelemetry’s Go, Java and .NET SDKs, and New Relic plans to add more in the future. Each exporter provides language-specific instructions on how to configure the exporter for an OpenTelemetry-instrumented codebase. After you configure an exporter, you’ll be able to send any distributed traces or metrics generated by OpenTelemetry to New Relic where you can start to explore metric and tracing data specific to your application.
Benefits and Patterns
Some of the typical challenges that I see over and over again are:
- Siloed information: Data scattered across various data silos, leaving you without a “single source of truth” for your operational data
- Tool sprawl: Dozens of disconnected tools to monitor different parts of your stack, forcing your engineers to scramble and switch between tools to investigate issues.
- Monitoring enforces architectural decisions: A monitoring tool enforces architectural decisions from a technical and/or from a commercial perspective.
The last one hurts me the most. I don’t recall how often I have seen environments that required changes to the underlying architecture because of the requirement to monitor certain parts of the stack. These requirements could be driven by technical reasons or limits of such an integration. Or, even worth, there could be commercial impact based on the way you architect your applications.
This brings me back to why I think Dapr and New Relic are better together. Software architecture should be simple, flexible and declarative. In short, it should be application-centric.
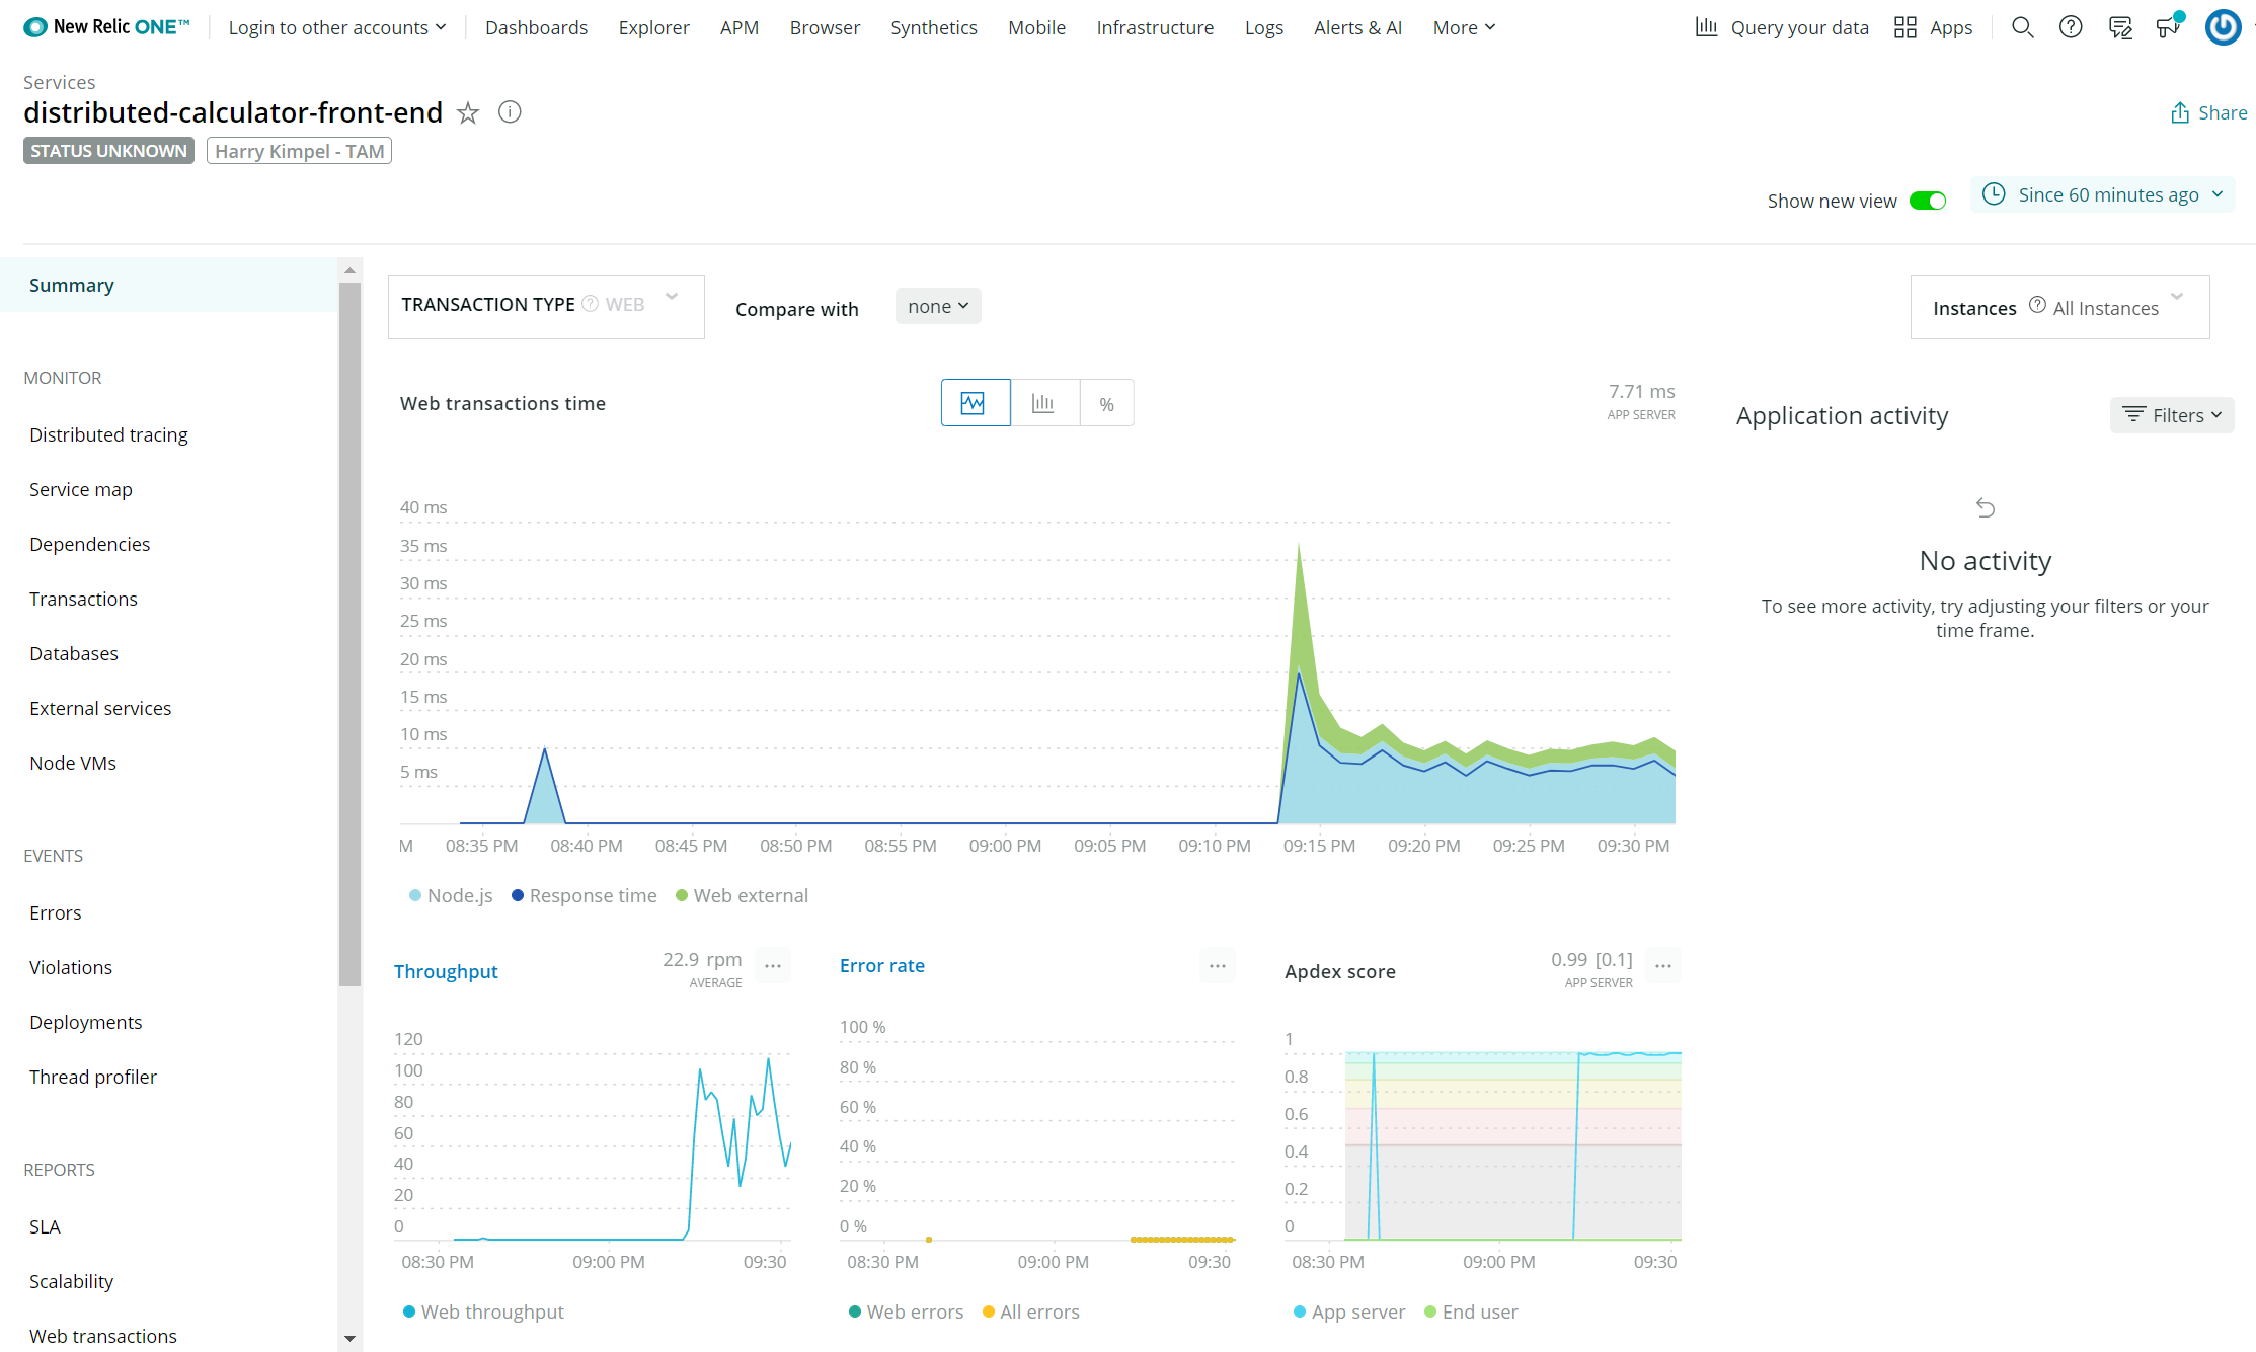
New Relic One is an entity- or application-centric environment that lets you see all dependencies and provides you with complete visibility into your stack. One of the main benefits of using New Relic as your observability tool is that the platform is provided as a fully managed SaaS service. You do not need to deploy and operate your own infrastructure or components to store and analyze all the different data types such as metrics, events, logs and traces. At the core of the New Relic platform is the Telemetry Data Platform. Telemetry Data Platform provides collectors for any type of data and telemetry.
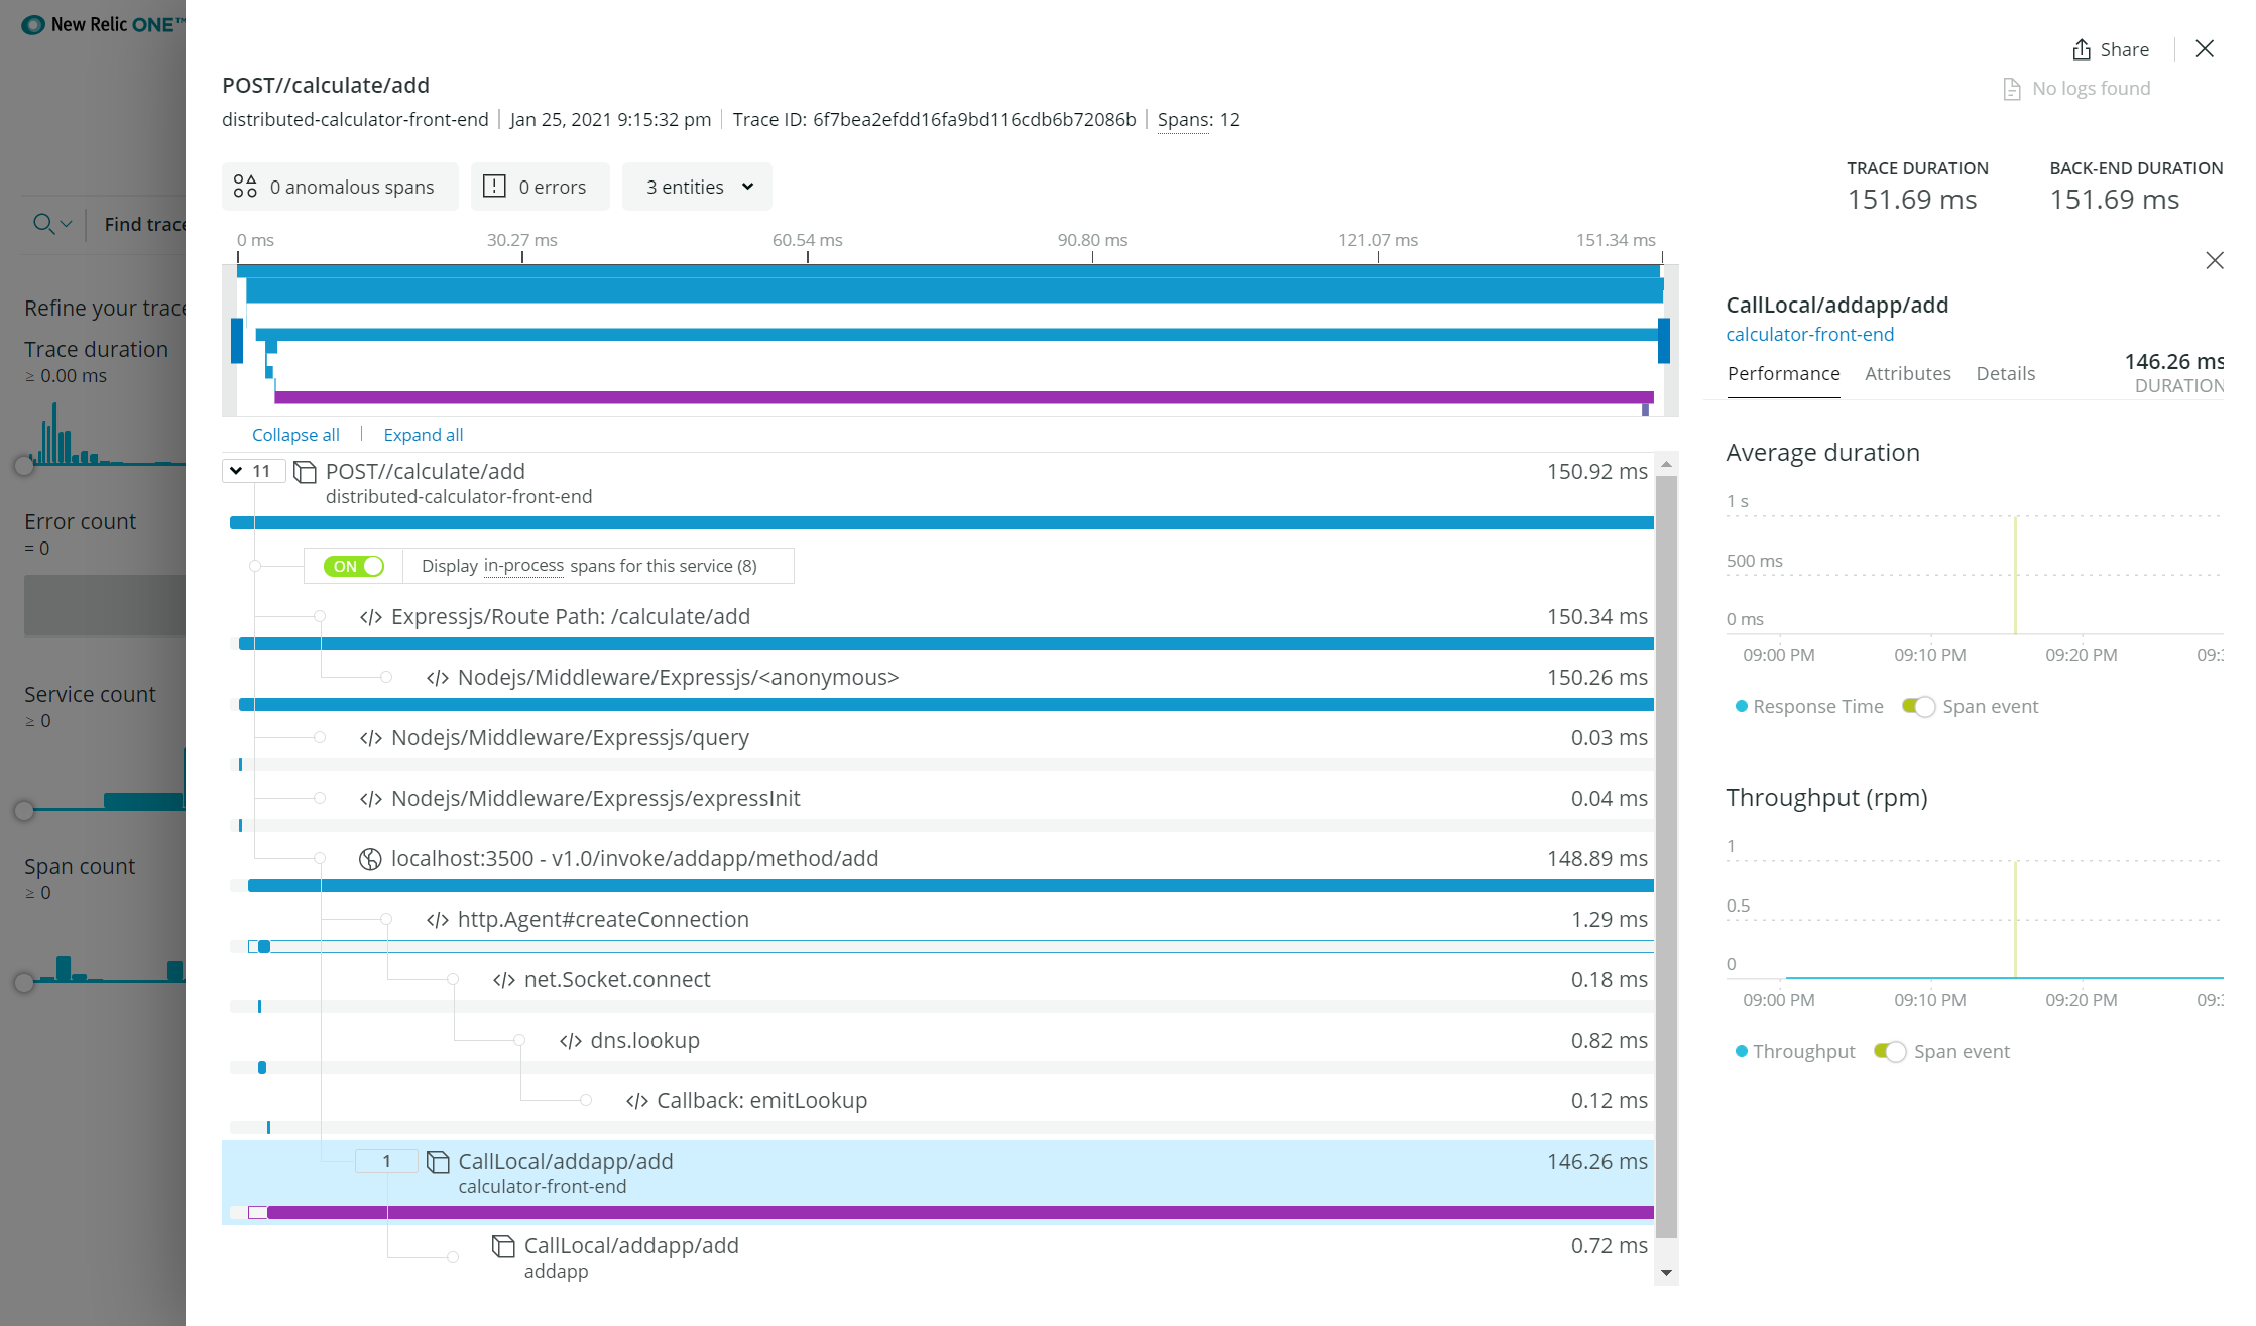
The benefits for Daperized applications are clear. Metrics and traces from applications can easily and quickly be sent to Telemetry Data Platform. With that configured, in a matter of minutes, you can leverage decades of experience of providing end-to-end curated user experiences. These allow you to go from a high-level overview of your applications and services all the way down into code-level details for performance problems or exceptions.
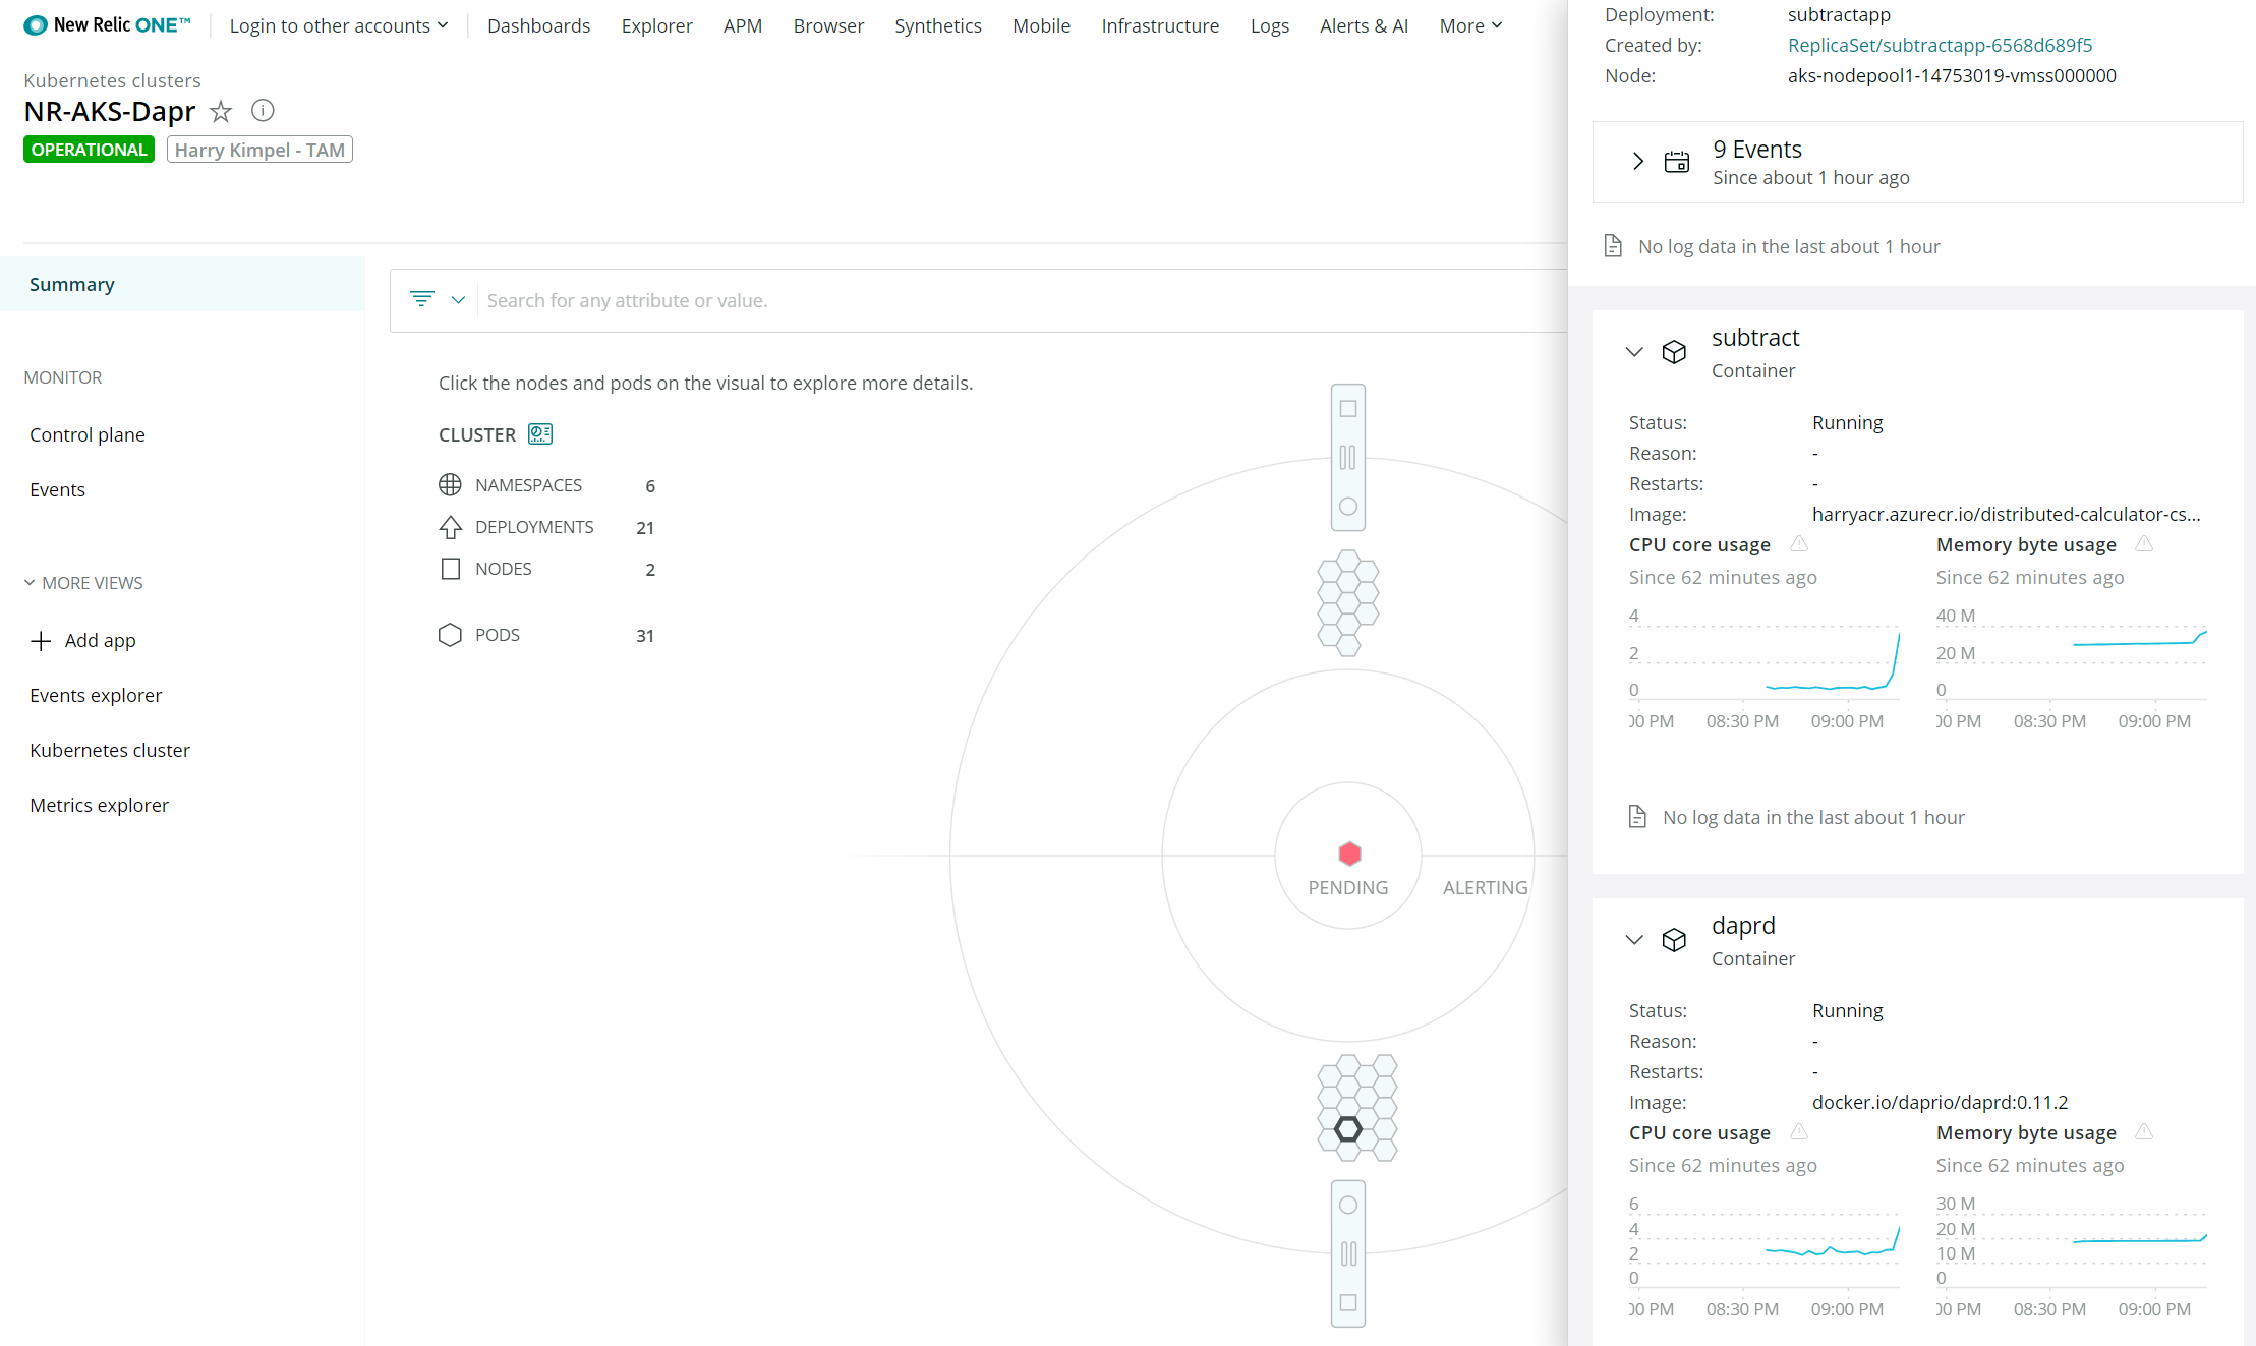
Correlating the information from Dapr applications with other metrics and events from environments such as Kubernetes is another benefit. Imagine if you have pod-level details in context with logs, metrics and traces from within a container. Everything just one click away. This is the true power of an observability platform such as New Relic One.
Getting started
In order to get started, here are a couple of links to documentation and resources that will help you with regards to next steps and further reading:
- Dapr Docs: How-To: Set-up New Relic for Dapr observability
- Perpetually free New Relic account, 100 GB/month of free data ingest, 1 free full access user, unlimited free basic users
- New Relic Blog: OpenTelemetry: Future-Proofing Your Instrumentation
- New Relic Blog: Troubleshoot your Applications faster with OpenTelemetry and New Relic One